Hattie interprets this as advancing student achievement by 3+ years!
This is an AMAZING claim if true: that merely predicting your grade, somehow magically 'influences' your achievement to that extent.
With that sort of power, why aren't most schools doing this?
I hope my beloved 'under-achieving' Australian football team – The St Kilda Saints are listening (the studies were also on athletic performance),
'Boys you can make the finals next year just by predicting you will - you don't need to do all that hard training!'Hattie used these 5 meta-analyses to get an average of d = 1.44.

The studies are mostly correlation studies and not true experiments as discussed in the page correlation.
These studies are an example of a major criticism of meta-analyses. Hattie acknowledges this and his defense is,
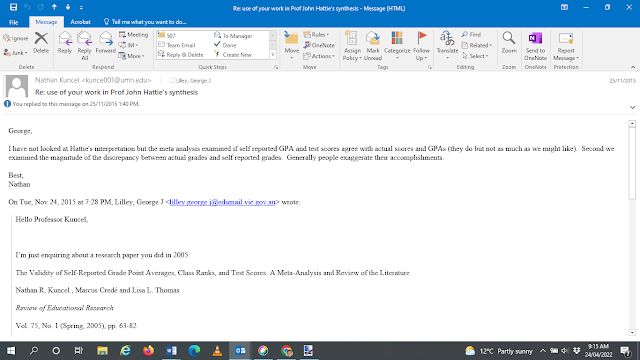
Kuncel et al. (2005) measured the student’s memory of their GPA score from a year or so previously; which is a measure of memory or honesty; not of students' predicting their future scores.
Kuncel et al. (2005, p. 64) state their aim:
Falchikov and Boud (1989, p. 396) compared staff with student self-marking as the experimental group. They conclude (p. 420),
The studies about self-reports are clearly NOT about influencing academic success.
Bergeron (2017) continues,
Schulmeister & Loviscach (2014) Critical Comments on the Study "Making Learning Visible" (Visible Learning).
Confirm Bergeron's concerns over using correlation and converting to an effect size.
Ivo Arnold (2011),

I noted from Vainker's post (July 2024) that Hattie had removed the Kuncel et al. (2005) study. Yet in 2023 in his updated book, Visible Learning the Sequel, Hattie promoted the Kuncel study (p. 85),

David Didau (2016) writes another excellent blog on this topic.
Dodiscimus (2014b)
"A common criticism is that it combines "apples with oranges" and such combining of many seemingly disparate studies is fraught with difficulties. It is the case, however, that in the study of fruit nothing else is sensible" (VL, p. 10).Dr. Kristen Dicerbo (2016) looked at each of these studies. A summary of what she found:
"Mabe & West (1982) This is a review of 55 studies. It is framed around the idea of understanding the validity of self-evaluation by correlating self-given grades to other grades. Are the self-given grades accurate? Are they related to more objective measures of achievement? They did NOT investigate whether changing the self-evaluation influences achievement. The average correlation between self-evaluation and achievement was .29, although across studies it ranged from -.26 to .80. The authors identify a number of ways to make the self-evaluations more accurate.
Fachikov & Boud (1989) This review examined 57 studies. They employed the commonly-used effect size measure. However, again, there weren’t control and experimental groups or studies about the effect of changing someone’s self-grade/self-expectation. Rather, the self-grade was coded as the experimental group and teacher grade as the control. The mean effect size is .47, with a range from -.62 to 1.42 across studies. They also report the mean correlation between self-graded and other-graded was .39.
Ross (1998) This study examines self-assessment in the context of whether a self-assessment can be used for placement in language classes as opposed to giving placement tests. They report the correlation between self-report and objective scores across 60 studies reviewed as .63. They then report an effect size, but it is an effect size for the correlation coefficient, not the traditional meta-analysis effect size that compares a control and experimental group. This effect size (g) is 1.63. Again, they don’t compare doing it versus not or any effect on achievement.
Falchikov & Goldfinch (2000) This study is actually about the relationship between peer grades and teacher grades. The overall correlation was .69, with a range from .14 to .99. Regardless, this study does not seem to fall into the category of self-assessment.
Kuncel, Crede, & Thomas (2005) This paper again looked at the reliability and validity of self-assessment BUT just by looking at whether the GPA and SAT scores that students were reporting were their real scores. In other words, this isn’t even really a judgment of their own expectations, but whether they remember and accurately report known scores. They compare reported to actual results from 37 different samples. So, sure the effect size for reported versus actual GPA was 1.38, but that just means college students can pretty accurately report their already known GPAs. Interestingly, they were quite poor at reporting SAT scores, with effect sizes of .33 for Verbal and .12 for Math."I've read each of the meta-analyses and confirm Dr. Dicerbo's analysis.
Kuncel et al. (2005) measured the student’s memory of their GPA score from a year or so previously; which is a measure of memory or honesty; not of students' predicting their future scores.
Kuncel et al. (2005, p. 64) state their aim:
"Since it is often difficult to get results transcripts of student PREVIOUS GPA’s from High School or College, the aim of this study is to see whether self-reported grades can be used as a substitute. This obviously has time-saving administration advantages."Falchikov & Goldfinch (2000, p. 288),
"We conceive of the present study as an investigation of the validity of peer marking."Mabe and West (1982, p. 281),
"The intent of this review is to develop general conclusions about the validity of self-evaluation of ability."Note: they measured over 20 different categories of achievement from scholastic, athletic, managerial to practical skills.
Falchikov and Boud (1989, p. 396) compared staff with student self-marking as the experimental group. They conclude (p. 420),
"most studies found positive effect sizes, indicating overrating on the part of student markers."Dicerbo concludes,
"It is clear that these studies only show that there is a correlation between students’ expected grades and their actual grades. That’s it (and sometimes not even that). They just say kids are pretty good judges of their current levels. They do not say anything about how to improve achievement. These studies are not intervention studies. In fact, if I were looking at all the studies about “influences” on achievement, I would not include this line of research. It is not about influencing achievement ...
In later work, Hattie is calling this finding self-expectation. The self-grading research seems to have gotten turned into the idea that these studies imply we should help kids prove those expectations wrong or that raising kids’ expectations will raise their achievement ...
That is not what the studies that produced the 1.44 effect size studied. They looked at the correlation of self-report to actual grades, often in the context of whether self-report could be substituted for other kinds of assessment. None of them studied the effect of changing those self-reports. As we all know, correlation does not imply causation. This research does not imply that self-expectations cause grades."Ironically, Kuncel et al. (2005, p. 70), warn about misinterpretation of their work;
"Precise coding and combination of data are critical for the production of a meta-analysis. If data examining fundamentally different samples or variables are unintentionally combined, it may jeopardise the findings. The result would be a mixing of potentially different studies that could yield an uninterpretable blend. Stated simply, this is the old debate about comparing oranges versus apples."I contacted Dr. Kuncel to make sure I interpreted his study correctly, and he replied that the conclusion of the study was:
'Generally, people exaggerate their accomplishments.'

Another major issue is the Ross (1998) study uses English Second Language students, a very small or abnormal subset of the total student population. The page on Effect Size goes into detail about how abnormal populations give rise to larger effect sizes. So inferences should NOT be made about the general student population.
Bergeron (2017) insightfully identifies the overriding problem here,
"in addition to mixing multiple and incompatible dimensions, Hattie confounds two distinct populations:
1) factors that influence academic success and
2) studies conducted on these factors."
Bergeron (2017) continues,
"It is also with correlations that he obtains the so-called effect of self-reported grades, the strongest effect in the original version of Visible Learning. However, this turns out to be a set of correlations between reported grades and actual grades, a set which does not measure whatsoever the increase of academic success between groups who use self-reported grades and groups who do not conduct this type of self-examination."Bergeron also warns of the conversion of correlation to an effect size - see Correlation.
Schulmeister & Loviscach (2014) Critical Comments on the Study "Making Learning Visible" (Visible Learning).
Confirm Bergeron's concerns over using correlation and converting to an effect size.
Also, they note that the value of d = 0.60 cited by Hattie from the Kuncel, Crede & Thomas study, cannot be found nor reconstructed from the study (p. 6).
Ivo Arnold (2011),
"The paper [Kuncel (2005)] should not have been included in the analysis. This example does raise questions regarding the remaining average effect sizes." (p. 220).
Stephen Vainker in his post on X also questions Hatties interpretation and representation of these studies,

I noted from Vainker's post (July 2024) that Hattie had removed the Kuncel et al. (2005) study. Yet in 2023 in his updated book, Visible Learning the Sequel, Hattie promoted the Kuncel study (p. 85),

Dodiscimus (2014b)
"back to Hattie’s evidence then. I’m afraid the only way to report this is to go through the individual meta-analyses: Kuncel, Credé and Thomas (2005) were looking at the validity of self-reported Grade Point Averages. It’s not toally clear to me quite how GPAs work in the USA but I think this would be kind of the same as asking graduates in the UK what their final percentage mark was for their degree. The point of this meta-analyses is to try to establish the validity of researchers asking for GPA rather than getting it from a transcript of some sort so I don’t think this has any relevance to teachers – it’s just about whether people remember accurately and whether or not they lie."John Dunlosky
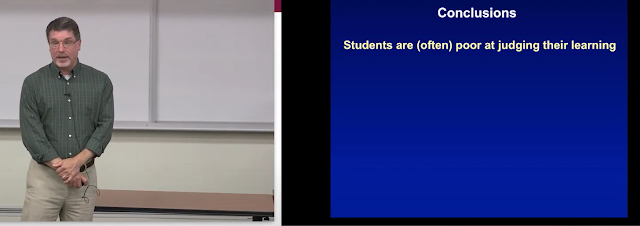
Has done a lot of research on this topic and warns there are a lot of issues with overconfident students that need to be addressed.
Also, Dunlosky concludes the opposite of Hattie - see his presentation here.

No comments:
Post a Comment